
We analyze your numbers like a personal CFO
Financial analytics means turning numbers into meaning, by pulling numbers from your bank accounts, tools, and systems into one clean, clever dashboard. Findash shows you what’s working, what’s not, and where your next opportunity lives. No finance wizardry required, just real insights, in real time. Ready to turn numbers into growth opportunities?

Smart, Simple Insights
See what’s actually going on in your business—without needing a finance degree or a dozen spreadsheets.

Growth-Focused Metrics
Find the signals in the noise. We surface the numbers that drive real decisions, not just nice-to-know stats.

No finance degree needed
Findash does the thinking for you. Even if you still Google “what is EBITDA” once a month, your analysis seems to be done by a financial master mind.
Build customisable dashboards & KPI’s
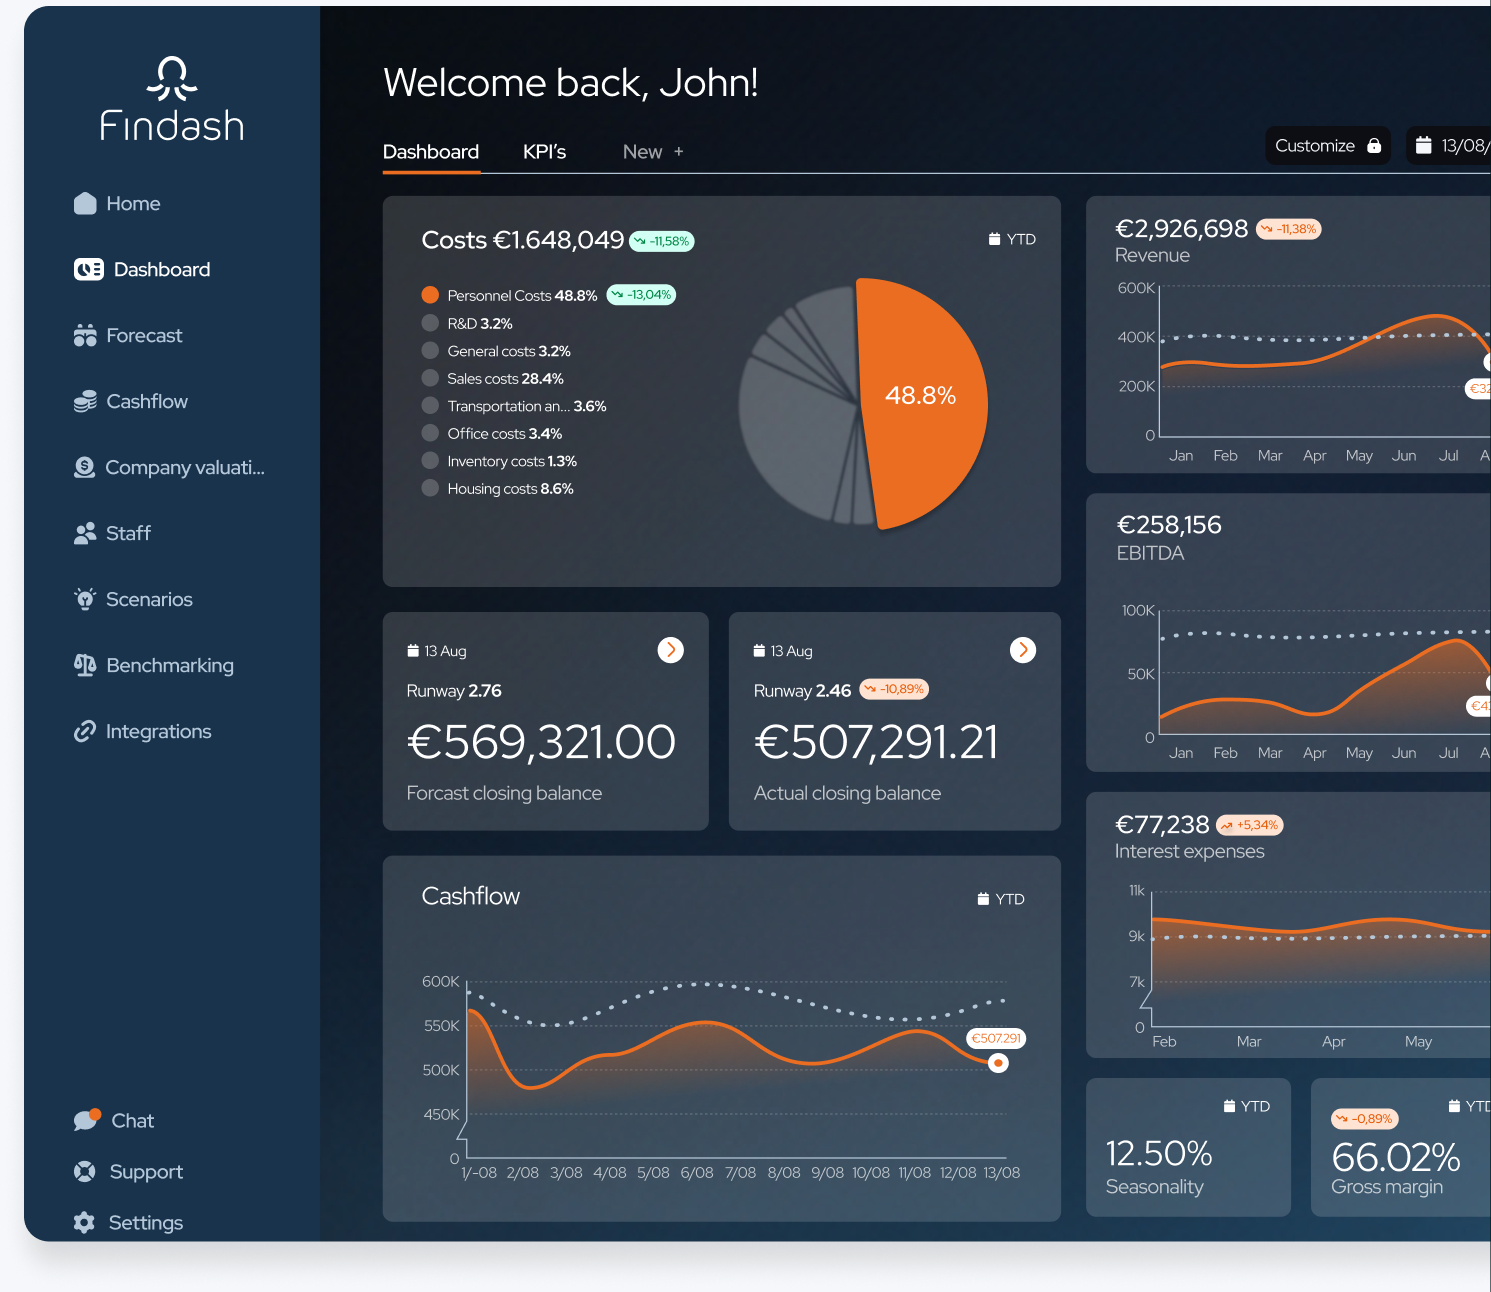
Drag. Drop. Done. Build your perfect dashboard with our drag-and-drop functionality. Choose the metrics you want, rename them however you like (yes, you can finally call that one "Profit Party"), and watch the data update live. This is analytics on your terms.
- Drag-and-drop layout editor
- Custom metrics & calculated fields
- Rename, group, and reorder KPIs your way
- Real-time visualisations
- All based on your own data, instantly visualised

Industry-specific KPIs & templates
No more wondering which numbers actually matter. Findash gives you pre-built dashboards based on your industry—whether you’re a SaaS company tracking MRR, or an agency watching billable hours. It’s plug-and-play, but with metrics that actually move the needle.
- Plug-and-play dashboard templates per industry
- Pre-selected KPIs that match your business model
- Flexible views: weekly, monthly, quarterly – whatever works for you
Realtime Analytics & Industry Insights
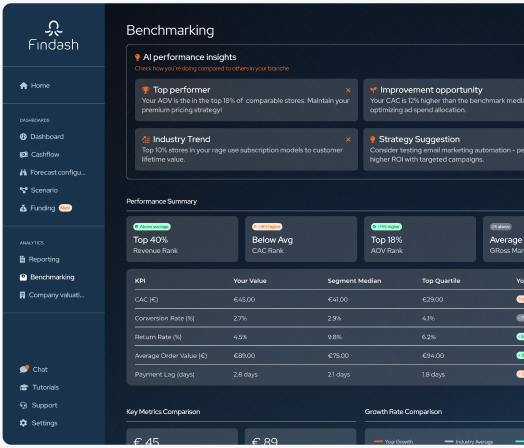
Don’t wait for end-of-month reports. See what’s happening right now. Findash pulls live financial data and turns it into clear, contextual insights – then shows you how you’re doing compared to industry standards. We call it friendly pressure.
- Live updates from all connected data sources
- Automated trend detection (hello, revenue spike)
- Industry benchmarking against similar businesses
- Smart alerts when something’s off – or awesome
Ready to see those analytics in action?Try Findash 30 days risk free.
More features
See all features
AI Powered Forecasting
Automated forecasts generated based on benchmarks, trends & historical data to which you can add scenario's & new plans easily. All set up in minutes.
Learn moreAI Powered Expertise
Your AI financial genius that translates complex metrics into clear, actionable recommendations.
Learn more
Dashboarding
Create the visuals you need, in the way you understand them. Use existing templates or create your own to visualise and measure data.
Learn more